
GEWU DOCUMENTATION
Smart Solution for Internet of Things in Greenhouses
From the "remote data viewing" to a digital production system featuring "real-time perception, edge decision-making, security control, precise planting, and continuous optimization".
What should I know about Smart Solution for Internet of Things in Greenhouses?
From the "remote data viewing" to a digital production system featuring "real-time perception, edge decision-making, security control, precise planting, and continuous optimization".
Evolve from “remote data viewing” to a digital production system featuring real‑time perception, edge‑based decision‑making, secure control, precision cultivation and continuous optimization.
This solution targets solar greenhouses, multi‑span glass greenhouses, multi‑span film greenhouses, seedling‑raising greenhouses, research greenhouses and large‑scale agricultural parks. It addresses key pain‑points in greenhouse production including unstable micro‑environment, low water‑fertilizer utilization efficiency, fragmented equipment systems, delayed fault response, non‑traceable production workflows and difficulty in quantifying operating returns. An integrated IoT system covering perception, transmission, control, platform, application and operation is constructed.
Instead of piling up excessive sensors and large‑screen displays, the solution centers on crop production objectives. It brings environment, root‑zone conditions, water‑fertilizer resources, energy, equipment, personnel and production batches into one closed‑loop digital workflow, enabling measurable production processes, controllable equipment actions, traceable abnormal events, evaluable operating performance and replicable proven planting experience.
1. Solution Overview
1.1 Construction Objectives
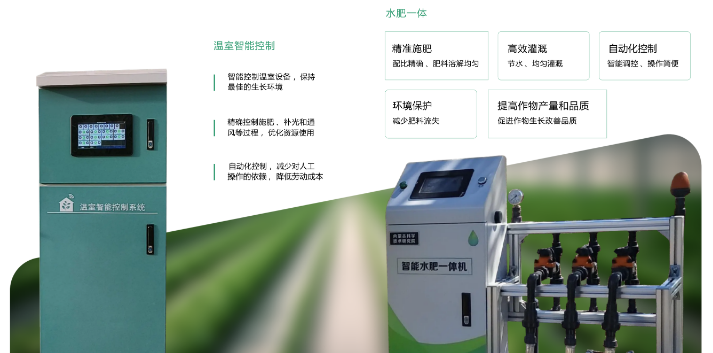
Build a cloud‑edge‑end collaborative greenhouse‑IoT intelligent system with six core capabilities:
- Real‑time Perception: Continuously collect data on greenhouse internal environment, outdoor meteorology, root‑zone conditions, water‑fertilizer status, energy consumption and equipment operation.
- Edge Autonomy: Local controllers execute approved control strategies and safety interlocks even when internet connectivity is lost.
- Coordinated Control: Coordinated operation of ventilation, shading, thermal insulation, heating, evaporative‑cooling fan units, irrigation, fertilization, supplementary lighting and CO₂ enrichment.
- Intelligent Early Warning: Proactive alerts for environmental threshold violations, sensor drift, equipment faults, irrigation anomalies and disease risks.
- Refined Operation: Closed‑loop management covering alarms, work orders, inspection tours, agricultural operations, input materials, harvesting and cost accounting.
- Continuous Optimization: Optimize control parameters, resource consumption and production strategies using historical data, comparative analysis and model algorithms.
1.2 Applicable Scenarios
| Scenario | Typical Requirements |
|---|---|
| Solar Greenhouse | Roller shutter control, top‑side ventilation, supplementary heating, drip irrigation, water‑fertilizer integration, mobile remote management |
| Multi‑span Glass / Film Greenhouse | Skylight & side‑window actuation, internal / external shading, evaporative‑cooling fan units, heating, supplementary lighting, CO₂ and water‑fertilizer linkage |
| Seedling‑raising Greenhouse | Multi‑zone layout, high‑precision environmental control, formula management, batch traceability and uniformity analysis |
| Research Greenhouse | Independent zoning, experimental parameters, historical‑data export, strategy versioning and permission audit |
| Agricultural Park | Centralized monitoring for multiple greenhouses, cross‑greenhouse benchmarking, energy metering, unified O&M and business analysis |
1.3 Solution Benefits
No uniform “yield‑increase percentage” guarantee is provided. Benefits are quantified against actual project baselines in the following dimensions:
- Improve compliance rate of target ranges for temperature, humidity, VPD, CO₂ and root‑zone environment;
- Reduce prolonged environmental threshold violations, equipment idling, frequent start‑stop cycles and control conflicts;
- Lower water, fertilizer, electricity and thermal consumption per unit area or per qualified product;
- Reduce manual inspection, manual logging, repetitive operations and night‑shift workload;
- Improve yield, commodity rate, batch uniformity and production stability;
- Shorten fault‑detection time and mean‑time‑to‑repair;
- Generate complete production datasets to support agricultural‑product traceability, cost accounting and large‑scale replication.
1.4 Value for Channel Partners
- Modular Architecture: Independent combinable modules for environmental monitoring, intelligent control, water‑fertilizer integration, energy management and platform applications;
- High Compatibility: Compatible with new‑build greenhouses and existing greenhouse retrofits; supports multi‑brand sensors and control devices;
- Sales‑friendly: Complete solution framework covering customer pain‑points, functional modules and implementation workflows;
- Easy Integration: Reduce integration complexity via standard protocols, unified point‑object models and open APIs;
- Replicable: Standardizable project templates for measuring points, equipment, control strategies and platform functions;
- Service‑oriented: Enable channel partners to provide site surveys, equipment selection, installation‑commissioning and long‑term O&M services.
2. Core Pain‑points of Greenhouse Production
2.1 Inaccurate & Incomplete Environmental Data
Many deployments only deploy a small number of temperature‑humidity sensors placed near greenhouse doors, air outlets, support columns, spray nozzles or under direct sunlight. Readings fail to represent the real micro‑environment at crop canopy level. Long‑term lack of calibration, condensation contamination, communication packet loss and sensor drift further degrade data reliability.
Mitigations:
- Divide control zones according to greenhouse structure, orientation, shading, air outlets, heating facilities, irrigation layout and crop varieties;
- Deploy representative measuring points at crop‑canopy height; adopt redundant / comparative measuring points for critical variables;
- Equip radiation shields, anti‑condensation measures, waterproof connectors and standardized mounting brackets;
- Establish data‑quality rules for value range, rate‑of‑change, inter‑point consistency and time‑series integrity;
- Implement workflows for incoming‑goods verification, on‑site calibration, periodic calibration and fault‑driven sensor replacement.
2.2 Fragmented Equipment with Diverse Protocols
Sensors, control cabinets, roller‑shutter actuators, window openers, fans, water pumps, fertilizer applicators, supplementary lights and video devices may be sourced from multiple vendors. Divergent communication protocols, point‑naming conventions and data formats often result in isolated independent platforms.
Mitigations:
- Adopt unified equipment models, measuring‑point coding, data dictionaries and interface specifications;
- Use edge gateways to adapt Modbus RTU/TCP, 4‑20 mA, 0‑10 V, DI/DO, LoRaWAN, MQTT and HTTP interfaces;
- Clarify requirements for open protocols, point tables, APIs, data export and system migration prior to project kick‑off;
- Establish unified associations among parks, greenhouses, zones, equipment, measuring points, crop batches, control strategies and work orders.
2.3 Automated Control Limited to Simple Threshold Switching
Single‑variable threshold control easily causes frequent equipment cycling and environmental oscillation. For example, windows open immediately once temperature exceeds threshold and close upon minor temperature drop. Blind ventilation under high‑humidity conditions may introduce risks in low‑temperature, high‑wind or rainy weather.
Mitigations:
- Apply target value ranges, hysteresis, time‑delay, minimum run‑time and minimum stop‑time parameters;
- Define equipment priorities, action grading, state‑machines and control‑conflict matrices;
- Incorporate multi‑variable inputs including outdoor meteorology, solar radiation, VPD, crop phenological stage and equipment feedback;
- Validate limit positions, opening degree, current, flow or environmental response for every control action;
- For complex strategies, conduct historical‑data playback, simulation validation and gray‑scale deployment on single zones.
2.4 Irrigation & Fertilization Based on Empirical Experience
Fixed‑schedule / fixed‑duration irrigation cannot adapt to variations in solar irradiance, temperature, evapotranspiration, substrate moisture and crop growth stages. Without monitoring of flow, pressure, EC, pH, mother‑liquid level and drainage conditions, problems such as over‑irrigation, under‑irrigation, salt accumulation, inaccurate fertilization and uneven end‑of‑line water distribution may occur.
Mitigations:
- Determine irrigation timing comprehensively based on substrate moisture / matrix tension, root‑zone EC, cumulative solar radiation, VPD, weather forecasts and production plans;
- Achieve precision fertigation via target EC/pH setpoints, feed‑forward flow parameters and feedback correction;
- Monitor main‑/branch‑pipe pressure, instantaneous flow, cumulative flow, valve feedback and filter differential pressure;
- For soilless‑culture projects, monitor drainage volume, drainage ratio and drainage EC/pH;
- Implement safety interlocks including pump lockout on low liquid level, fertilizer shutdown on zero flow, over‑pressure shutdown and abnormal‑valve‑feedback protection.
2.5 Abundant Alarms without Closed‑loop Handling
Conventional platforms merely send SMS or App push notifications, lacking alarm classification, suppression, escalation, assignee assignment, work‑order generation and recovery confirmation. Operators tend to become desensitized to repeated alarms over long‑term operation.
Mitigations:
- Classify alarms into informational, minor, major and emergency levels;
- Suppress and consolidate jitter‑triggered, same‑source and cascading alarms;
- Automatically associate equipment information, location, real‑time trends, historical faults and recommended handling steps;
- Auto‑generate, escalate and chase work orders according to assignees and SLA rules;
- Verify fault elimination via data and equipment feedback upon repair completion.
2.6 Over‑reliance on Cloud Platform & Public Network
When all control logic resides in the cloud, production continuity is directly jeopardized by network outages, platform malfunctions or carrier anomalies.
Mitigations:
- Deploy critical control strategies on local intelligent gateways or edge controllers;
- Cloud platform handles configuration, analytics and multi‑greenhouse management and shall not replace on‑site safety controls;
- Edge devices support local data caching, resume transmission after disconnection and offline operation;
- Deploy dual links of wired broadband plus 4G/5G for high‑priority projects;
- Retain local HMI, manual‑auto toggle, emergency‑stop and safety fallback capabilities on‑site.
2.7 Opaque Energy, Water‑fertilizer and Labor Costs
Merely aggregating total park water‑ and electricity bills cannot identify resource efficiency gaps among individual greenhouses, equipment groups or crop batches. Quantifying management returns from intelligent retrofits becomes difficult.
Mitigations:
- Establish four‑level metering: park‑level master meters, greenhouse sub‑meters, system sub‑item meters and key‑equipment meters;
- Associate water consumption, fertilizer usage, electricity consumption, thermal energy and labor inputs with greenhouse zones and crop batches;
- Calculate resource consumption per unit area and per qualified product;
- Set up control‑group vs test‑group greenhouses to evaluate returns across full production cycles.
3. Overall Technical Architecture
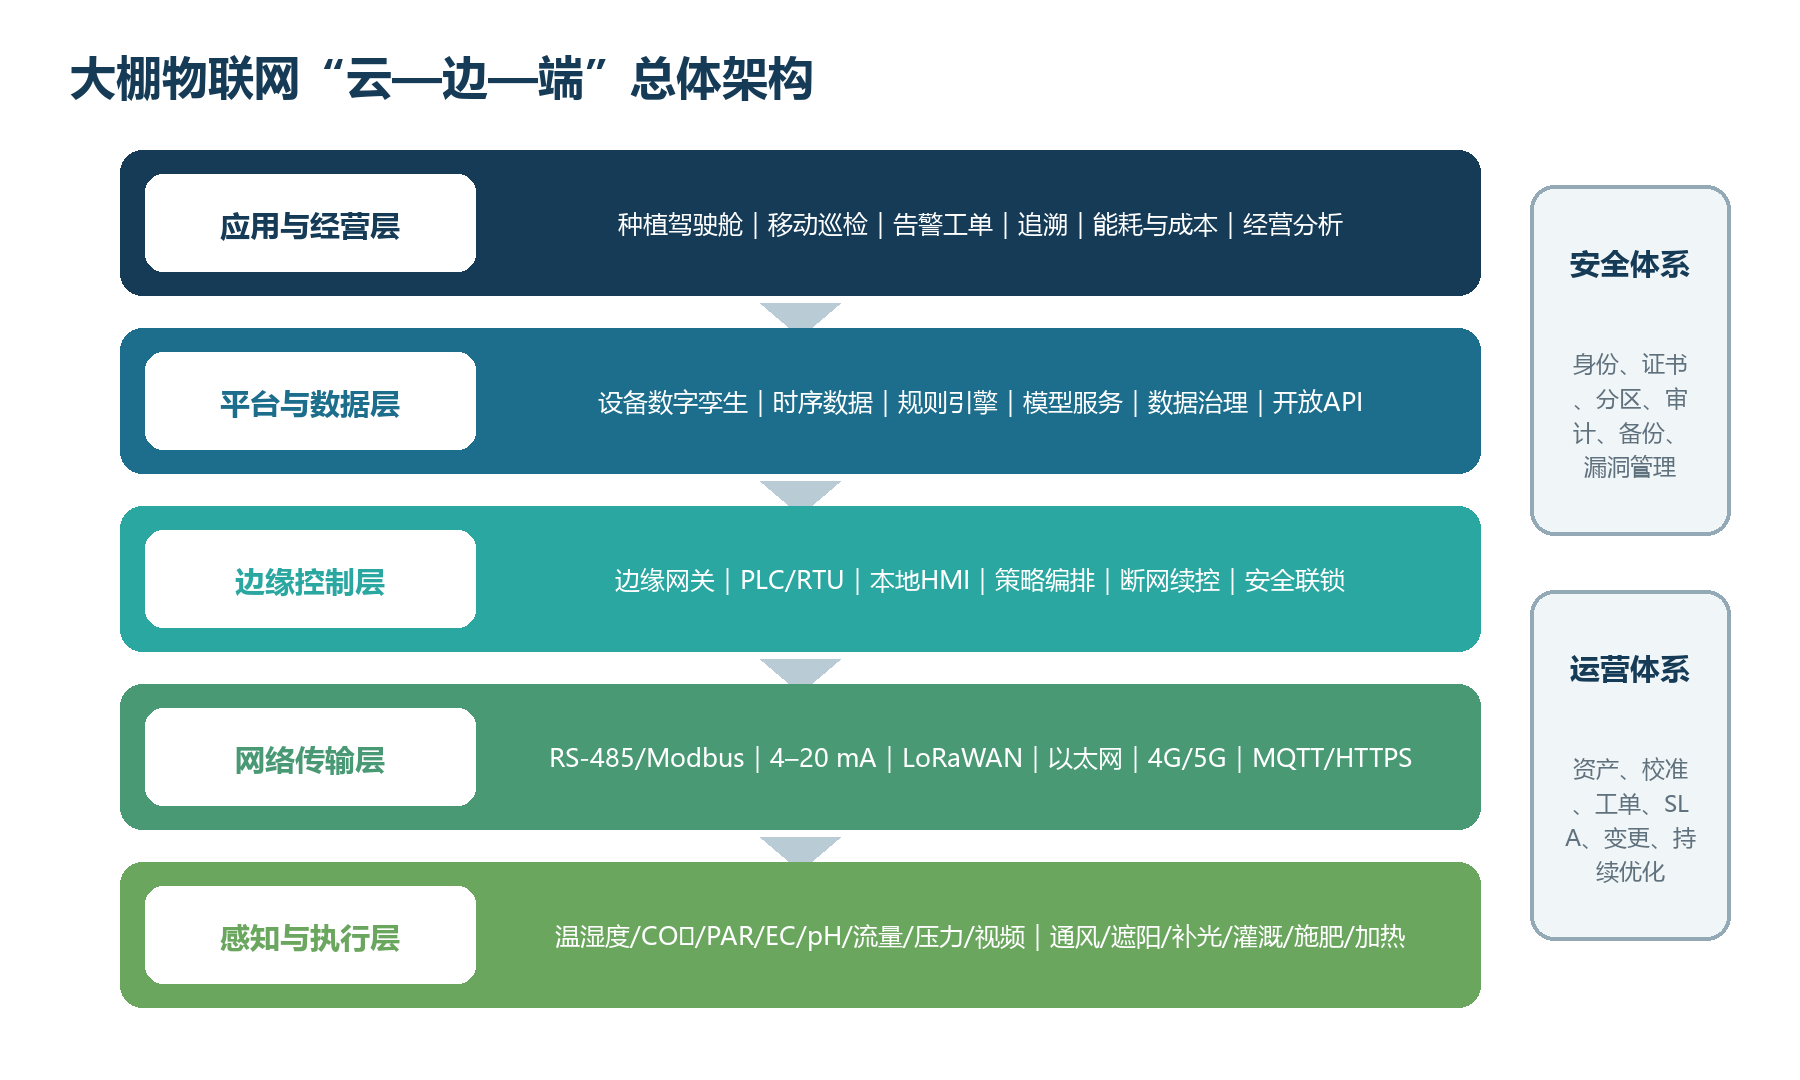
The system adopts a five‑layer architecture: Perception‑Network‑Edge‑Cloud‑Application. Security and operation‑maintenance systems run through the full lifecycle.
Drawing on domain‑partition and collaborative concepts specified in national standard GB/T 33474‑2025 Internet of Things — Reference Architecture[2], a cloud‑edge‑end collaborative model is established to satisfy continuous production and on‑site safety requirements for protected agriculture.
- Cloud Layer: Global configuration, data analytics, cross‑greenhouse management and model services.
- Edge Layer: Real‑time control, protocol adaptation, safety interlock and control continuation upon network loss.
- End Layer: Perception and actuation.
Architecture‑layer Responsibilities
| Layer | Primary Responsibilities | Key Quality Attributes |
|---|---|---|
| Perception & Actuation Layer | Collect environmental, root‑zone, water‑fertilizer, equipment and video data; execute ventilation, shading, irrigation and other actions | Accurate measurement, actionable feedback, environmental robustness |
| Network Transmission Layer | Connect field‑bus systems, wireless sensor networks, park intranets and public networks | Zoning, redundancy, anti‑interference, diagnosability |
| Edge Control Layer | Protocol conversion, data caching, real‑time rules, interlock logic, on‑site HMI | Low latency, offline operability, rollback‑capable strategies |
| Platform & Data Layer | Equipment models, time‑series data, rule‑ / model‑services, APIs, master‑data and data governance | Unified semantics, extensibility, auditability |
| Application & Business Layer | Operation dashboard, alarms, work orders, traceability, cost accounting, mobile workflows and reports | Role‑oriented and business‑closed‑loop |
Unified Object Model
The platform shall at minimum model relationships among: Park — Greenhouse — Zone — Equipment — Measuring Point — Actuator — Crop Batch — Strategy — Alarm — Work Order — Input Material — Output Batch.
- Each measuring‑point record shall contain: unit, measuring range, accuracy, sampling period, quality code, calibration date, spatial position and affiliated zone.
- Each control‑action record shall contain: command, approval trace, execution feedback, failure reason and recovery status.
4. Perception & Monitoring System
4.1 Recommended Monitoring Objects
| Monitored Object | Key Variables | Layout & Application Notes |
|---|---|---|
| Greenhouse Air Environment | Temperature, relative humidity, CO₂, VPD | Deploy multiple points near crop canopy; avoid direct sunlight, spray zones and air outlets |
| Light Environment | Total solar radiation, PAR, light duration | Combine outdoor reference station and representative indoor points; regular cleaning required |
| Root‑zone / Substrate | Moisture / matrix tension, temperature, EC | Distribute points per irrigation zone, substrate type and representative plants |
| Water‑fertilizer System | Raw‑water / nutrient‑solution EC, pH, flow, pressure, liquid‑level, temperature | Cover pump inlet‑outlet, fertigation outlet, main‑pipe, branch‑pipe and drainage lines |
| Outdoor Meteorology | Temperature‑humidity, wind‑speed & direction, precipitation, solar radiation | Install with unobstructed view; implement lightning‑protection and maintenance access |
| Equipment Status | Start‑stop state, opening degree, limit switches, current, frequency, fault codes | Log actual feedback instead of merely recording issued commands |
| Crop & Disease Risk | Leaf‑wetness, canopy temperature, growth imagery, pest imagery | Correlate with environmental and agricultural‑operation events on unified time axis |
| Resource Metering | Water, electricity, heat, gas, CO₂ flow | Define metering boundaries per greenhouse or cost‑center |
4.2 Data Quality Management
Each measuring‑point record shall include unit, measuring range, accuracy, sampling period, reporting period, quality code, calibration date and affiliated zone. The system performs the following checks:
- Range Check: Detect out‑of‑physical‑range or out‑of‑equipment‑range readings;
- Rate‑of‑change Check: Identify value jumps, stuck readings and anomalous fluctuations;
- Consistency Check: Compare deviations between adjacent and redundant measuring points;
- Time‑series Check: Detect timestamp errors, out‑of‑order samples and duplicate entries;
- Missing‑data Check: Distinguish short‑term packet loss vs long‑term offline events and trigger corresponding degradation strategies.
Data failing quality checks shall not directly feed into automatic controls. Upon failure of critical measuring points, switch to redundant sensors or activate conservative strategies and generate alarms.
5. Network & Edge Control System
5.1 Communication Technologies
| Tier | Recommended Technologies | Design Requirements |
|---|---|---|
| Sensor‑to‑Actuator | 4‑20 mA, 0‑10 V, DI/DO, RS‑485, Modbus RTU | Robust, interference‑resistant, diagnosable; implement isolation and surge protection |
| In‑Greenhouse & Park‑level | Industrial Ethernet, RS‑485, LoRaWAN, Wi‑Fi | Prioritize wired links for critical controls; perform coverage validation for wireless links |
| Edge‑to‑Cloud | MQTT over TLS, HTTPS, VPN, 4G/5G, Broadband | Device certificates, heartbeat monitoring, resume‑transmission, link supervision |
| Third‑party Integration | REST API, message queues, standardized file exchange | Versioned interfaces, rate‑limiting, authorization, audit logs and data dictionaries |
5.2 Edge‑control Capabilities
- Support access for multi‑vendor sensors, frequency converters, valves, controllers, fertilizer applicators and power meters;
- Locally persist raw data, quality codes, control logs and alarms; resume sequential upload upon cloud‑network recovery;
- Support scheduling‑timer, threshold‑hysteresis, time‑delay, state‑machine, PID and model‑based control modes;
- Implement safety interlocks for wind‑rain conditions, limit‑positions, liquid‑levels, pressure, flow and access permissions;
- Local HMI clearly displays auto‑mode, manual‑mode, maintenance‑mode and fault states;
- Support configuration signature, version roll‑back, whitelisted firmware upgrade, runtime diagnostics and audit logs.
5.3 Fault Degradation Principles
- When cloud platform becomes unavailable, edge continues executing the most‑recent approved control strategy;
- Upon anomaly of critical sensors: switch to redundant measuring‑points or activate conservative controls;
- Upon equipment execution failure: halt correlated actions and raise major‑level alarms;
- Upon controller anomaly or power loss: actuators revert to predefined safe states;
- All degradation events, manual overrides and recovery procedures shall be logged for traceability.
6. Greenhouse‑environment Intelligent Control
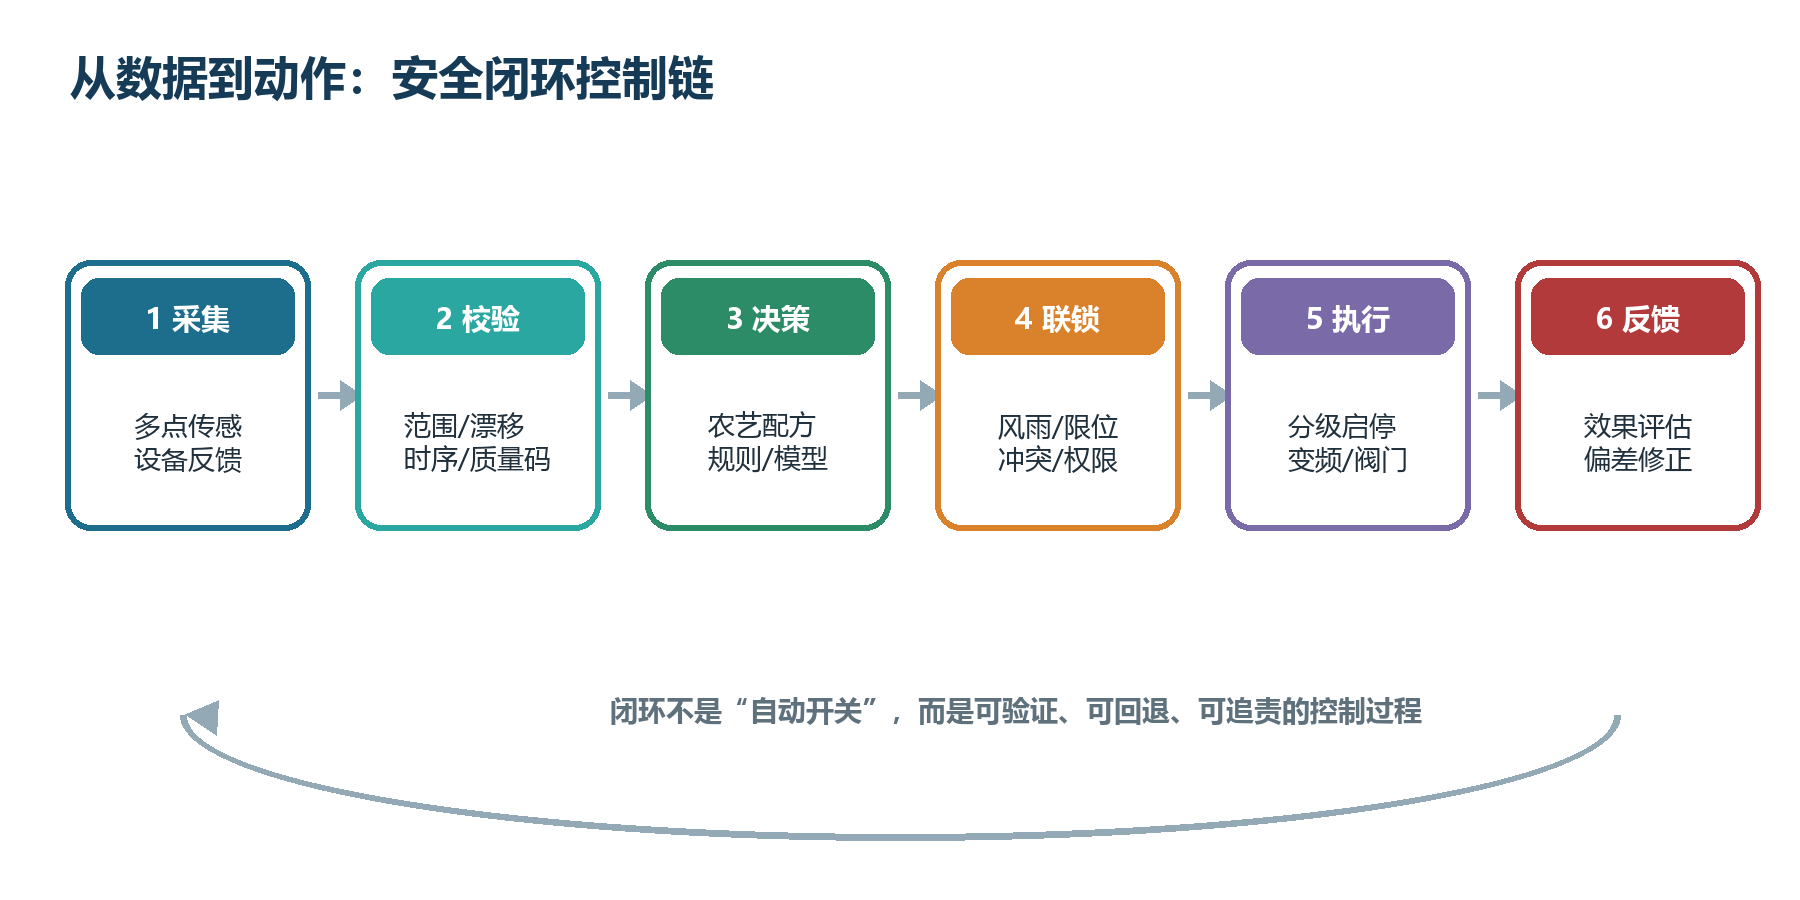
6.1 Safety‑closed‑loop Control Flow
Closed‑loop control is not merely simple auto‑switching. It is a complete workflow including data validation, strategy evaluation, safety interlock, action execution, feedback confirmation and deviation correction.
6.2 Typical Control Strategies
| Scenario | Primary Inputs | Action Strategy | Safety Constraints |
|---|---|---|---|
| High‑temperature | Greenhouse‑internal temperature, solar radiation, outdoor temperature, wind‑rain status | Skylight / side‑window → circulating fan → external shading → evaporative‑cooling fan units | Wind‑rain interlock limit, graded actions, prevent frequent cycling |
| High‑humidity / Condensation Risk | Temperature‑humidity, VPD, leaf‑wetness, dew‑point | Ventilation, short‑time heating, circulating fans, adjust irrigation schedule | Balance low‑temperature risk and disease‑prevention requirements; night‑time thermal constraints |
| Low‑temperature | Inside‑outside temperature, solar radiation, heat‑source status | Thermal‑insulation curtain → reduce ventilation → graded heating | Over‑temperature protection, heat‑source safety & capacity constraints |
| Low‑CO₂ | CO₂ concentration, ventilation opening‑degree, solar radiation, personnel status | Perform CO₂ enrichment under adequate light and low‑ventilation conditions | Personnel‑safety rules, leakage alarm, upper‑concentration limit |
| Supplementary Lighting | PAR, cumulative light integral, electricity price, temperature | Supplement light based on solar integral and crop phenological stage | Power‑distribution capacity, thermal‑load constraints, peak‑valley price strategy |
6.3 Auxiliary Control with VPD
VPD (Vapor‑Pressure Deficit) quantifies crop transpiration driving force and serves as a better indicator than relative‑humidity alone.
SVP(T) = 0.6108 × exp(17.27T / (T + 237.3))
VPD = SVP(T) × (1 − RH / 100)
VPD target ranges must be defined per crop variety, phenological stage, light intensity, root‑zone water supply and cultivation pattern; generic fixed thresholds shall not be directly applied.
6.4 Control‑strategy Management
- Record reason, approver, scope of application, effective time and roll‑back version for every parameter modification;
- Validate complex strategies via historical‑data playback or digital simulation before formal roll‑out;
- Deploy on single zone / reference greenhouse for gray‑scale trial before full‑scale promotion;
- Continuously observe target variables, equipment feedback and resource consumption after strategy activation;
- Trigger diagnostics or roll‑back automatically when expected performance is not achieved.
7. Intelligent Irrigation & Water‑fertilizer Integration
7.1 System Composition
Intelligent fertigation system includes water source, water‑storage facilities, filters, mother‑liquid tanks, fertigation channels, mixing units, pump banks, main pipes, branch pipes, zone valves, drip‑irrigation end‑users and drainage‑monitoring components.
7.2 Irrigation‑decision Inputs
- Root‑zone moisture / matrix tension, root‑zone temperature and root‑zone EC;
- Cumulative solar‑radiation / PAR, greenhouse VPD and weather forecasts;
- Main‑ / branch‑pipe pressure, instantaneous‑flow, cumulative‑flow and valve feedback signals;
- Raw‑water and nutrient‑solution EC, pH, temperature and mother‑liquid liquid‑level;
- For soilless culture: drainage volume, drainage ratio and drainage EC/pH;
- Crop variety, phenological stage, production plan and agronomic prescriptions.
7.3 Closed‑loop Control Flow
flowchart LR
    A[Root‑zone demand & meteorological conditions] --> B[Generate irrigation task]
    B --> C[Start pump‑bank and zone valves]
    C --> D[Confirm flow‑pressure status]
    D --> E[EC/pH fertigation closed‑loop regulation]
    E --> F[Control by cumulative‑flow & duration]
    F --> G[Root‑zone & drainage feedback]
    G --> H[Prescription review & optimization]
7.4 Safety Interlocks
- Disable fertigation upon low mother‑liquid level;
- Halt pumps and fertigation under zero‑flow, insufficient‑flow or abnormal‑pressure conditions;
- Stop current‑zone task upon missing‑valve‑feedback or large deviation between actual‑flow and planned‑flow;
- Switch to clear‑water mode or trigger safe shutdown upon sustained EC/pH out‑of‑range;
- Mutually interlock auto‑flushing, filter back‑washing and irrigation tasks;
- Complete each irrigation mission jointly judged by cumulative‑flow, equipment feedback and root‑zone response.
8. Energy & Resource Management
8.4 Four‑level Metering Framework
Adopt following metering boundaries:
- Park‑level total water, electricity, heat and gas consumption;
- Sub‑meter for individual greenhouse / production unit;
- Sub‑item metering for lighting, heating, cooling, fans, pumps, fertigation and control systems;
- Metering for key pumps, fans and supplementary‑lighting circuits.
8.2 Resource‑efficiency Indicators
| Indicator | Recommended Statistical Standard |
|---|---|
| Water Consumption per Unit Area | m³/mu, m³/m² or project‑specific unified standard |
| Water Consumption per Qualified Product | m³/t or L/kg |
| Energy Consumption per Qualified Product | kWh/t or kWh/kg |
| Fertilizer Consumption per Unit Yield | kg/t |
| Labor Input per Unit Yield | h/t |
| Environment‑compliance Cost | Water, electricity, heat and labor consumed to maintain target‑value ranges |
8.3 Optimization Directions
- Schedule water‑storage, heat‑storage and shift‑able supplementary‑lighting tasks according to peak‑valley electricity prices;
- Analyze efficiency correlation among pump / fan power, flow‑rate and pressure;
- Evaluate environment‑compliance costs of combined ventilation‑heating‑evaporative‑cooling‑circulating‑fan schemes;
- Identify clogging, idling, filter fouling, bearing anomalies and degrading equipment efficiency;
- Associate resource statistics with crop batches, yield and commodity rates to calculate real per‑product costs.
9. Platform Function Design
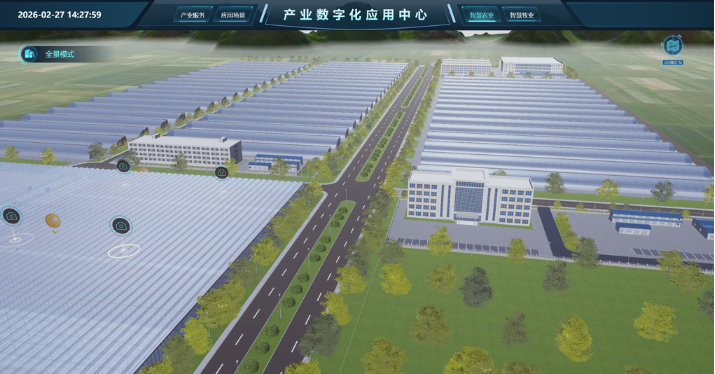
9.1 Operation Dashboard
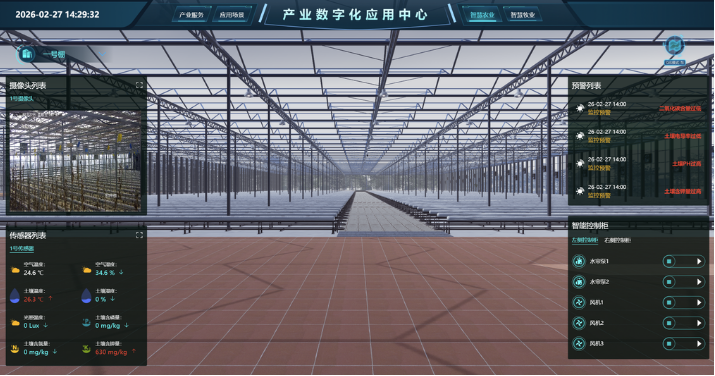
Aggregated overview of park status, per‑greenhouse environment, equipment states, yield, commodity rates, water‑fertilizer energy consumption, alarms, downtime and costs. Support drill‑down analysis filtered by park, greenhouse, zone, crop, batch and time range.
9.2 Environment & Equipment Monitoring
- Real‑time readings, trend curves, spatial comparison and historical‑data playback;
- Equipment operating status, opening‑degree, frequency, current, limit‑position signals and fault codes;
- Identification of auto‑mode, manual‑mode, maintenance‑mode and offline‑mode;
- Remote equipment operation, secondary‑confirmation, permission‑control and operation‑audit logs.
9.3 Alarm & Work‑order Management
- Alarm classification, suppression, merging, escalation and recovery confirmation;
- Auto‑associate equipment, location, real‑time trends, fault history and recommended resolution steps;
- Auto‑dispatch and escalate work‑orders per responsible zone, on‑duty personnel and SLA rules;
- Record root‑causes, resolution measures, time‑cost, spare‑parts and recurrence status;
- Build equipment‑fault knowledge base and O&M‑performance reports.
9.4 Agronomic & Production Management
- Crop varieties, phenological stages, transplant‑harvest schedules and production plans;
- Environment‑target values, irrigation‑fertigation formulas and strategy version management;
- Agricultural tasks: sowing, transplanting, pruning, pollination, plant‑protection, harvesting etc.;
- Input‑material batches, consumption quantities, responsible operators and timestamps;
- Traceability covering production batches, environment records, input‑materials, harvesting, grading and sales destinations.
9.5 Mobile‑client Functions
Mobile‑client supports alarm reception, task dispatching, QR‑code‑driven inspection, photo logging, equipment‑status viewing, authorized operations and on‑site work‑order processing. The system serves field production crews instead of only operating‑room large‑screen displays.
10. Data Governance & Artificial Intelligence
10.1 Data‑governance Framework
| Data Domain | Main Contents | Governance Requirements |
|---|---|---|
| Master‑data | Parks, greenhouses, zones, equipment, crops, personnel, input‑materials | Unified coding, definitions and responsible‑person assignments |
| Time‑series Data | Measured values, quality‑codes, timestamps and equipment‑states | Preserve both raw and corrected values |
| Event‑data | Control actions, alarms, work‑orders, agricultural operations, formulas and strategy‑versions | Full‑link traceability |
| Indicator‑data | Units, accuracy, statistical periods, calculation formulas and business definitions | Maintain unified indicator‑definition library |
| Data Lifecycle | Hot‑data, historical archiving, backup, export and deletion | Tiered retention according to value and compliance constraints |
10.2 AI Application Scenarios
AI capabilities shall be built incrementally subject to data maturity:
| Maturity Level | Typical Capabilities | Prerequisites for Launch |
|---|---|---|
| L1 Diagnostics | Anomaly detection, drift identification, equipment‑fault correlation | Stable‑quality datasets plus fault‑case records |
| L2 Prediction | Short‑term temperature‑humidity forecasting, disease‑risk assessment, water‑energy‑yield prediction | Sufficient stable historical‑data, weather and batch‑feature records |
| L3 Recommendation | Irrigation timing, formula tuning, equipment‑combination and maintenance suggestions | Interpretable rules, human‑approval workflow and comparative validation |
| L4 Optimized Control | Model‑predictive control, environment‑optimization under resource‑cost constraints | Reliable edge‑control capacity, safety constraints, gray‑scale trial and roll‑back mechanisms |
10.3 AI Safety Requirements
- Explicitly define applicable crops, seasons, data scope and forbidden‑usage scenarios for every model;
- Display confidence metrics and key reasoning evidence; models shall never override on‑site safety interlocks;
- Require human confirmation or dual conditions for high‑risk actions;
- Continuously monitor data drift, model performance and seasonal variation;
- Instant roll‑back to validated rule‑based strategies upon model anomalies.
11. Cyber‑security & Data Security
Greenhouse‑IoT systems combine information‑technology and field‑control systems. Security design shall balance data‑security, equipment‑safety, production continuity and personnel‑safety.
11.1 Security Measures
| Security Domain | Primary Measures |
|---|---|
| Identity Security | Unique accounts, multi‑factor authentication, device certificates; prohibit shared administrator accounts |
| Network Boundary | Segregate production‑control network, management network and guest network; remote‑access via controlled entry‑points |
| Communication Security | TLS, VPN, certificate‑rotation, interface signature and replay‑attack prevention |
| Device Security | Minimize exposed services, whitelists, patch assessment, USB‑port control and configuration backup |
| Application Security | Least‑privilege model, approval workflows, secondary‑confirmation for sensitive operations and comprehensive audit logs |
| Data Security | Classification‑grading, minimal data collection, encryption, backup, retention and data‑portability support |
| Security‑operation | Centralized log‑management, anomaly‑detection, emergency‑response plans, recovery drills and post‑incident reviews |
11.2 Hard Rules for On‑site Control‑system Safety
- Safety interlocks shall not depend on public‑network connectivity;
- Remote commands shall never bypass local limit‑switches, emergency‑stops and equipment‑protection logic;
- Firmware upgrades, strategy distribution and bulk‑parameter modifications must validate signatures, permissions and version‑identifiers;
- High‑risk actions such as CO₂ enrichment, heating, main‑pump and master‑valve operations shall have independent protection mechanisms;
- All automated equipment shall retain on‑site manual safety‑override capability.
12. Project‑implementation Workflow
12.1 Phased‑construction Approach
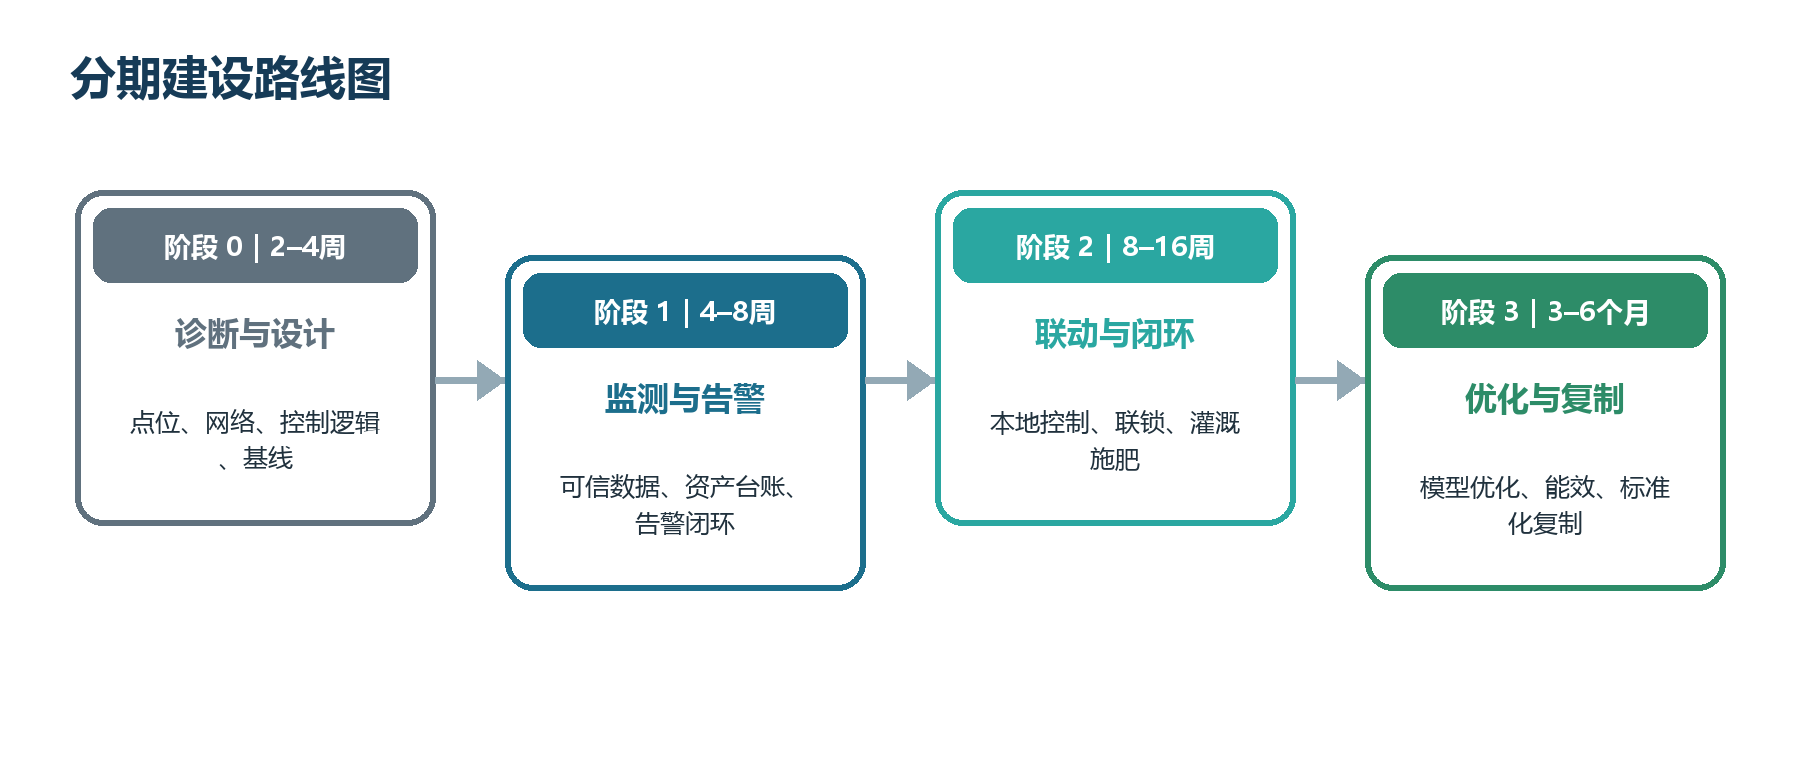
Phase 0: On‑site Survey & Detailed Design
- Inventory greenhouse structures, equipment, control cabinets, electrical‑capacity, network infrastructure and fault‑history;
- Conduct requirement interviews grouped by crop types, zones and production workflows;
- Deliver measuring‑point table, I/O list, network topology, data dictionary and interlock‑matrix;
- Establish baseline metrics for water‑fertilizer consumption, energy‑usage, labor input, yield, commodity‑rate and fault‑statistics.
Phase 1: Monitoring, Asset‑management & Alarm Functions
Complete sensor installation, equipment onboarding, unified naming, asset ledgers, real‑time trends, alarms and mobile‑inspection workflows. Prioritize solving data‑credibility and equipment‑visibility problems.
Phase 2: Interlock‑enabled Closed‑loop Operation
Select low‑risk, high‑return zones for pilot closed‑loop ventilation or fertigation deployments. Complete strategy configuration, interlock‑logic, action feedback, offline‑network drills, manual‑override workflows and agronomic validation.
Phase 3: Optimization & Large‑scale Replication
Deploy cross‑greenhouse benchmarking, energy‑efficiency optimization, predictive‑maintenance, disease‑risk forecasting and business‑analysis capabilities. Generate standardized measuring‑point templates, control‑strategies, reports and delivery artifacts.
12.2 90‑day Pilot‑project Recommendation
- Day 1‑15: On‑site survey, requirement analysis, zoning‑planning, measuring‑point definition and project‑scope confirmation.
- Day 16‑45: Installation & onboarding, data‑governance, asset‑management, trend‑visualization, alarms and mobile‑inspection functions.
- Day 46‑70: Launch safety‑closed‑loop for one ventilation or irrigation scenario and complete fault‑simulation drills.
- Day 71‑90: Operational review, parameter‑optimization, user‑training, preliminary‑benefit evaluation and expansion‑decision‑making.
13. Channel Delivery & O&M Assurance
13.1 Stakeholder Roles
| Role | Core Responsibilities |
|---|---|
| Channel Partner / Reseller | Customer‑requirement communication, project‑scope confirmation, commercial coordination and on‑site‑resource organization |
| Technical Solution Provider | Measuring‑point layout, equipment‑selection, system‑architecture, control‑logic and platform‑configuration support |
| Agronomic Consultant | Environment‑target values, irrigation‑fertigation prescriptions, strategy suggestions and planting‑effect reviews |
| Construction‑implementation Contractor | Equipment‑mounting, cabling, control‑cabinet wiring, system‑joint‑commissioning and on‑site‑training |
| O&M‑service Provider | Inspection tours, calibration, repair, spare‑parts support, remote‑diagnosis and emergency‑response |
| End‑user Operator | Daily operation, alarm‑response, agricultural‑task execution and on‑site‑problem feedback |
13.2 Preventive‑maintenance Checklist
| Cycle | Recommended Activities |
|---|---|
| Daily / Per‑shift | Check critical alarms, pump‑valve status, liquid‑levels, communication status, auto‑manual mode, abnormal noise and leakage |
| Weekly | Clean sensors, inspect filter differential‑pressure, verify backups, runtime‑hours and anomalous trends |
| Monthly | Validate full‑stroke travel of windows / valves, emergency‑switch‑over, account‑settings, reports and anomalous trends |
| Quarterly / Pre‑season | Sensor cross‑calibration, electrical‑terminal tightening, lightning‑protection‑grounding check, spare‑parts inventory and seasonal‑strategy switching |
| Annual | Metrological calibration, special‑inspection for pressure‑ and safety‑equipment, disaster‑recovery drill and overall‑system health assessment |
13.3 Change‑management Process
Equipment‑replacement, firmware‑upgrades, measuring‑point renaming, strategy‑parameter modification, network‑rule adjustments and platform‑version‑updates shall strictly follow the workflow:
Proposal → Evaluation → Approval → Backup → Testing → Gray‑scale Deployment → Validation → Closure + Roll‑back‑preparedness.
Unauthorized temporary field‑rewiring and parameter‑tweaking are common root‑causes for long‑term automation‑system degradation.
14. Three‑tier Deployment Options
| Deployment Mode | Scope of Delivery | Core Value | Applicable Scenarios |
|---|---|---|---|
| Basic‑monitoring Edition | Environment, root‑zone, water‑fertilizer monitoring, alarms, mobile‑client and asset‑management | Solve problems of poor visibility, slow‑fault‑detection and incomplete‑recording | Small‑scale greenhouses or first‑time digital‑transformation |
| Closed‑loop‑control Edition | Add edge‑control, interlock‑logic, water‑fertilizer management, energy‑statistics and work‑orders | Deliver executable, verifiable production closed‑loops | Mainstream solution for large‑scale commercial production |
| Optimized‑operation Edition | Add cross‑greenhouse benchmarking, prediction‑functions, model‑optimization, traceability and business‑analysis | Improve per‑product profitability and multi‑site replicability | Multi‑greenhouse / multi‑base mature‑operation deployments |
15. Project‑risks & Mitigation
| Risk | Typical Manifestation | Mitigation Measures |
|---|---|---|
| Requirement‑drift | Continuous scope‑creep during implementation dilutes core‑project objectives | Freeze Phase‑1 scope; route additional‑features through formal change‑control |
| Mis‑placed Measuring‑points | Readings appear normal but do not represent actual crop‑zone micro‑environment | Involve agronomists in layout‑design; perform spatial‑comparison and mobile‑validation |
| Uncontrollable Legacy‑equipment | Missing feedback‑signals, absent interlocks and frequent mechanical‑failures | Complete mechanical‑electrical retrofits prior to enabling automatic‑control |
| Protocol Lock‑in | Vendor refuses to release point‑tables and interface‑documents | Explicitly specify protocols, data‑ownership, export‑ and exit‑clauses within contracts |
| Over‑automation | Deploy unvalidated models directly for equipment‑control | Tiered‑maturity workflow, human‑approval, gray‑scale‑trial and safety‑roll‑back |
| Low User‑adoption | System decoupled from on‑site team workflows | Co‑design workflows with end‑users; simplify mobile‑interfaces; deliver training & assessment |
| Insufficient O&M Investment | System performance rapidly degrades post‑warranty | Secure annual‑budget, SLA agreements, spare‑parts provision and knowledge‑transfer |
| Cyber‑security Threats | Exposed remote‑access portals, default‑passwords and shared‑accounts | Network‑segmentation, MFA, device‑certificates, audit‑logs and emergency‑response drills |
| Homogenized Solution | Merely lists hardware without scenario‑specific differentiation | Assemble functional‑modules tailored to greenhouse‑type, crop‑variety and customer‑maturity |
16. Conclusion
The core objective of greenhouse‑IoT intelligent construction is not merely deploying remote‑monitoring dashboards. Instead, it transforms crop‑production goals into an executable, verifiable, traceable and optimizable digital closed‑loop.
A mature solution shall satisfy all of the following requirements:
- Trustworthy perception of environment, root‑zone, water‑fertilizer, energy and equipment status;
- Local‑control and safety‑interlock mechanisms independent of public‑network access;
- Coordinated control for ventilation, shading, temperature‑regulation, water‑fertilizer and supplementary‑lighting;
- Business closed‑loops covering alarms, work‑orders, agricultural‑operations, traceability and cost‑accounting;
- Unified object‑model, open‑interfaces and long‑term data‑governance;
- Phased‑roll‑out, standardized‑delivery and sustainable‑operation mechanisms.
Only when technical systems are tightly integrated with agronomic‑management, production‑workflows and business‑metrics, can greenhouse‑IoT evolve from “view‑only monitoring” toward “practical usability”, shifting from equipment‑automation to production‑intelligence.
17. Reference Policies & Standards
Standard status shall be checked against the National Standards Information Public‑service Platform at project kick‑off. Local projects shall additionally comply with regional building, electrical‑engineering, water‑saving, environmental‑protection and agricultural‑regulations.
- Action Plan for National Smart Agriculture (2024‑2028), Ministry of Agriculture and Rural Affairs of P.R.China
- GB/T 33474‑2025, Internet of Things — Reference Architecture
- GB/T 44985.1‑2024, General Technical Requirements for Agricultural Internet of Things — Part 1: Field Planting
- JB/T 10306‑2013, Code for Design of Greenhouse Control System
- JB/T 10296‑2013, Code for Electrical Wiring Design of Greenhouse
- GB/T 29148‑2012, Technical Code for Energy‑saving of Greenhouses
- GB/T 43182‑2023, Agricultural Socialized Service — Specification for Greenhouse Construction Service
- NY/T 3223‑2018, Code for Design of Solar Greenhouse
- GB/T 22239‑2019, Information Security Technology — Baseline for Classified Protection of Cybersecurity
- GB/T 35273‑2020, Information Security Technology — Personal Information Security Specification
- Data Security Law of the People's Republic of China
- Personal Information Protection Law of the People's Republic of China
- Decision of the Standing Committee of the National People's Congress on Amending the Cybersecurity Law of the People's Republic of China